

ISU presents GraphGen Storyteller, a sheet for creating a detailed 'story' graph that works with data from trackmate, slottrak, slotmaster and race coordinator
|
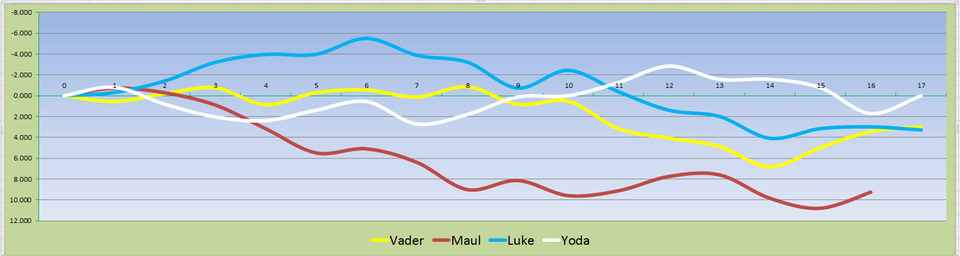
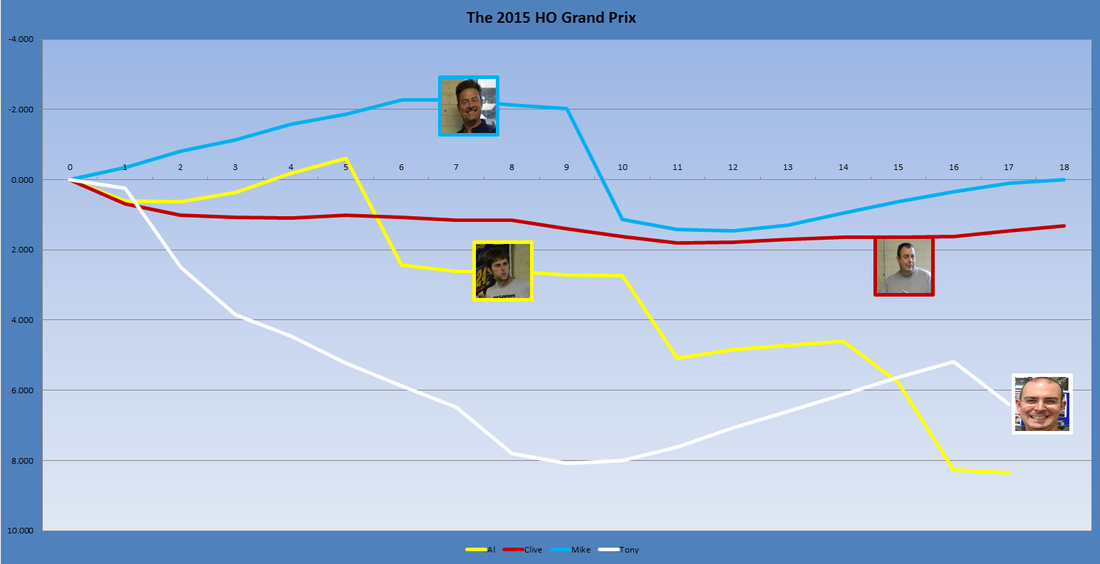
This graph compares everyone's cumulative laptime against the average of the winner, so you can really see the ebb and flow of a race.
| ||

|
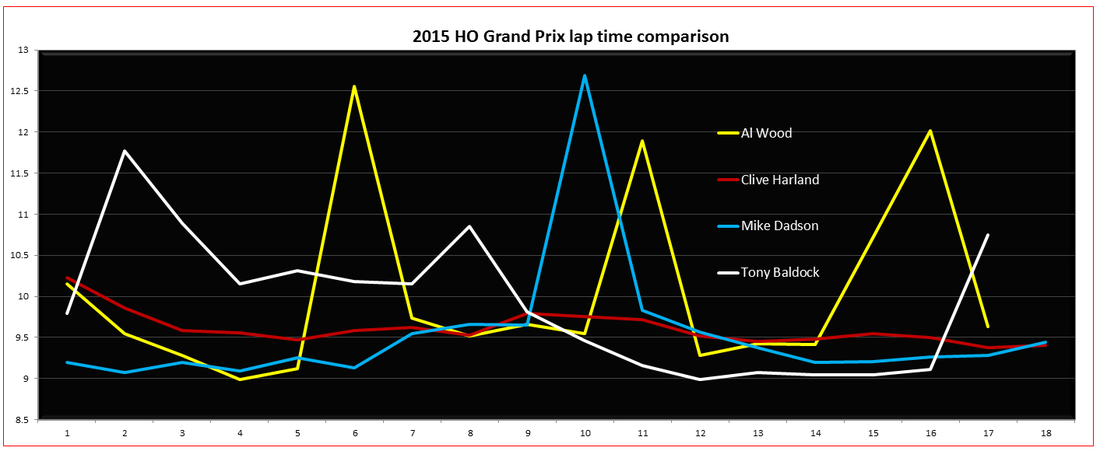
ISU presents GraphGen Original, a sheet for creating graphs that works with data from trackmate, race coordinator, slotmaster and slottrak |
| graphgen_v1.11_for_8_lanes.xlsx |
| graphgen_v1.11_for_6_lanes.xlsx |
| graphgen_v1.11_for_5_lanes.xlsx |
| graphgen_v1.11_for_4_lanes.xlsx |
| graphgen_v1.11_for_3_lanes.xlsx |
| graphgen_v1.10_for_four_lanes_single_sheet.xlsx |
Thanks to: Kev Gray, 'RickXL', Brian Rogers, 'shg', Alan Wood and the Excel community.
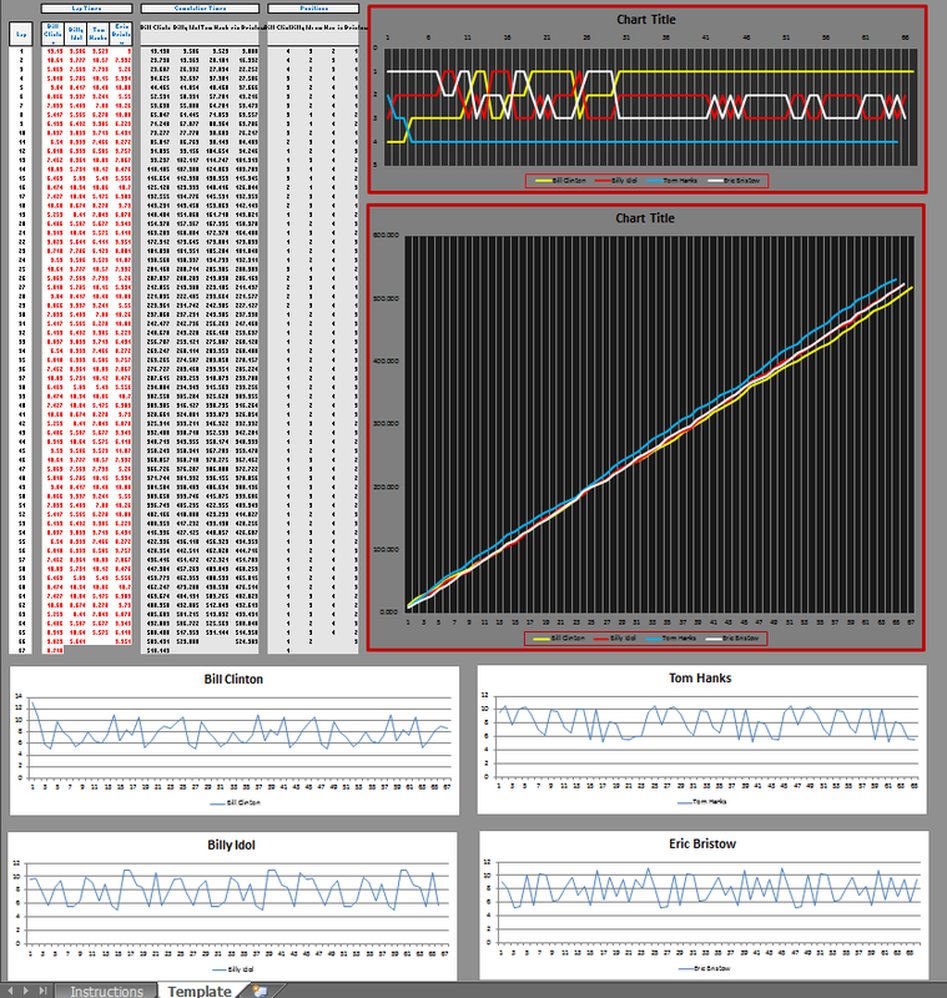
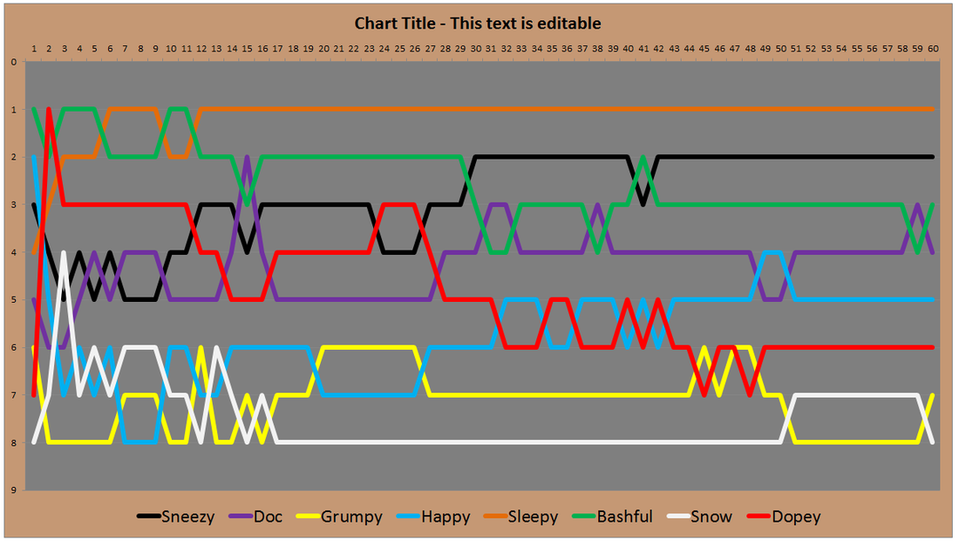
Examples of GraphGen in use with actual race data:
For Bjarne

|
| ||
